TL;DR: New analytics dashboard shows form views, submissions, conversion rates, and performance insights to help optimize your forms.
Form Analytics
Understanding how your forms perform is crucial for optimization. Formshive now provides comprehensive analytics to track:
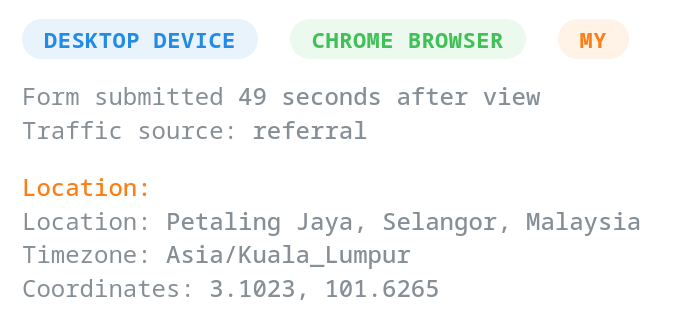
- Form views: Who’s seeing your forms and from where
- Conversion rates: How many viewers actually submit
- Traffic sources: Which channels drive the most submissions
- Geographic insights: Where your audience is located
- Device breakdown: Mobile, tablet, and desktop usage
Key Metrics
Conversion Tracking
See your form’s conversion rate over time with daily breakdowns. Track how changes to your form affect submission rates and identify high-performing periods.
Traffic Analysis
Understand where your form traffic comes from:
- Direct visits
- Google search results
- Social media referrals
- Email campaigns
Device Insights
Monitor how users interact with your forms across devices. Optimize for mobile if that’s where most conversions happen, or improve desktop experience based on your data.
Privacy-First Analytics
All analytics respect user privacy:
- No cookies required: Works without tracking cookies
- IP hashing: IP addresses are immediately hashed, never stored raw
- GDPR compliant: Designed for European privacy standards
Getting Started
Analytics are automatically enabled for all forms. View your stats by:
- Going to your form dashboard
- Selecting a form
Use Cases
Lead Generation: Monitor which traffic sources convert best and focus your marketing efforts accordingly.
Form Optimization: A/B test form changes and measure their impact on conversion rates.
Audience Insights: Understand your global reach and optimize for your primary geographic markets.
Performance Monitoring: Identify trends and seasonal patterns in form usage.
The analytics feature helps you make data-driven decisions about your forms while maintaining strong privacy protections for your users.